Introduction
If you missed the news, Kibana 4.1 was made available two weeks ago (June 10, 2015) and also Elasticsearch 1.6 (June 9, 2015) and Logstash 1.5.1 (June 16, 2015).This is a second post to share around Kibana 4 this time, the first post was here : monitoring-cisco-asa-logs-with-elk.html
IMHO, Kibana 4.1 is much more interesting than Kibana 4.0, but there are still some interesting ongoing work under the 4.2 release. I still prefer Kibana 3 for some points.
Dashboard migration in Kibana 4
Unfortunately, dashboard from Kibana 3 cannot be migrated to Kibana 4, but you can run both a the same time on your computer.Since Kibana 4.1 let us export objects, I have made an update to share new dashboards :
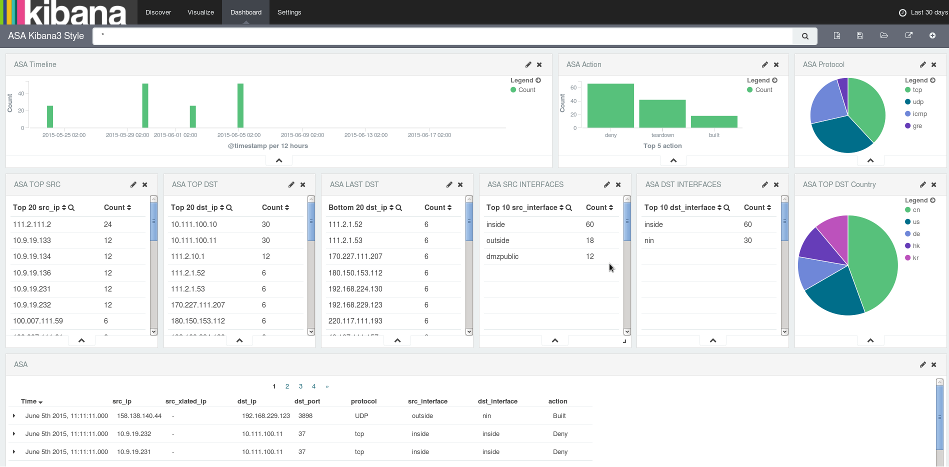
- One is "Kibana 3 style"
 |
| Former Kibana 3 Cisco ASA sample dashboard |
 |
| Kibana 3 style dashboard in Kibana 4 |
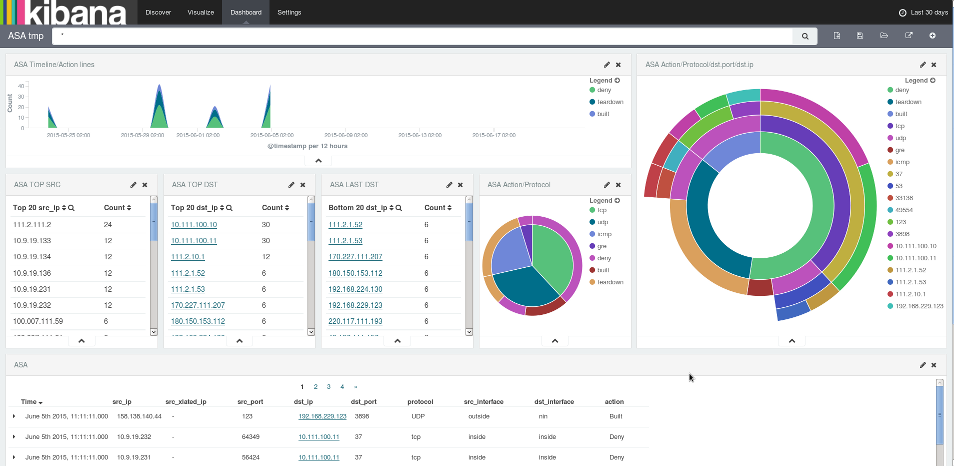
- The second is using some of the new features of Kibana 4.1
- Multiple aggregations
- Field formatting with URL links
 |
| Kibana 4.1 dashboard |


This comment has been removed by the author.
ReplyDeleteHello, i'm using logstash 2.x and I always have a _grokparsefailure. Have you an idea ? Thank you for your help
ReplyDeletehave you got the resolution the _grokparsefailure , _geoiplookup failure
ReplyDeleteanyone has kibana 6 dashboards?
ReplyDelete