Monday, June 22, 2015

Monitoring ASA log with ELK part 2

Introduction

If you missed the news, Kibana 4.1 was made available two weeks ago (June 10, 2015) and also Elasticsearch 1.6 (June 9, 2015) and Logstash 1.5.1 (June 16, 2015).

This is a second post to share around Kibana 4 this time, the first post was here : monitoring-cisco-asa-logs-with-elk.html

IMHO, Kibana 4.1 is much more interesting than Kibana 4.0, but there are still some interesting ongoing work under the 4.2 release. I still prefer Kibana 3 for some points.

Dashboard migration in Kibana 4

Unfortunately, dashboard from Kibana 3 cannot be migrated to Kibana 4, but you can run both a the same time on your computer.

Since Kibana 4.1 let us export objects, I have made an update to share new dashboards :
  • One is "Kibana 3 style"
Former Kibana 3 Cisco ASA sample dashboard
Kibana 3 style for kibana 4 dashboard
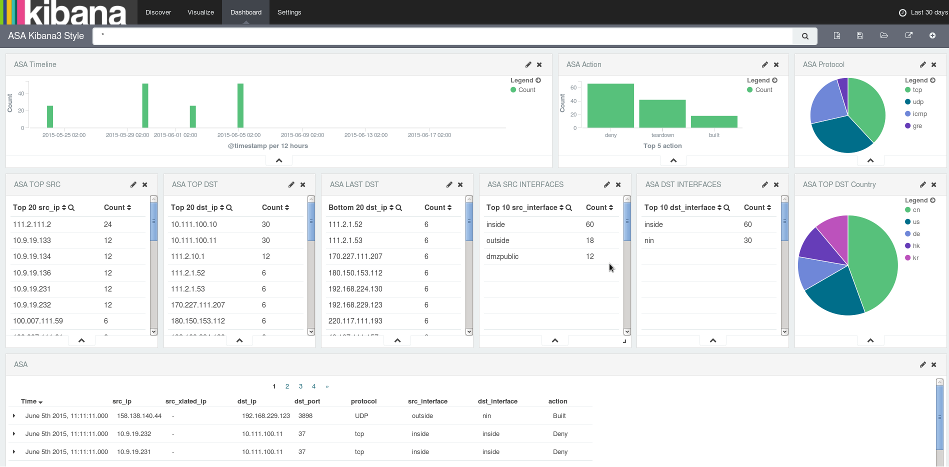
Kibana 3 style dashboard in Kibana 4
  •  The second is using some of the new features of Kibana 4.1
    • Multiple aggregations
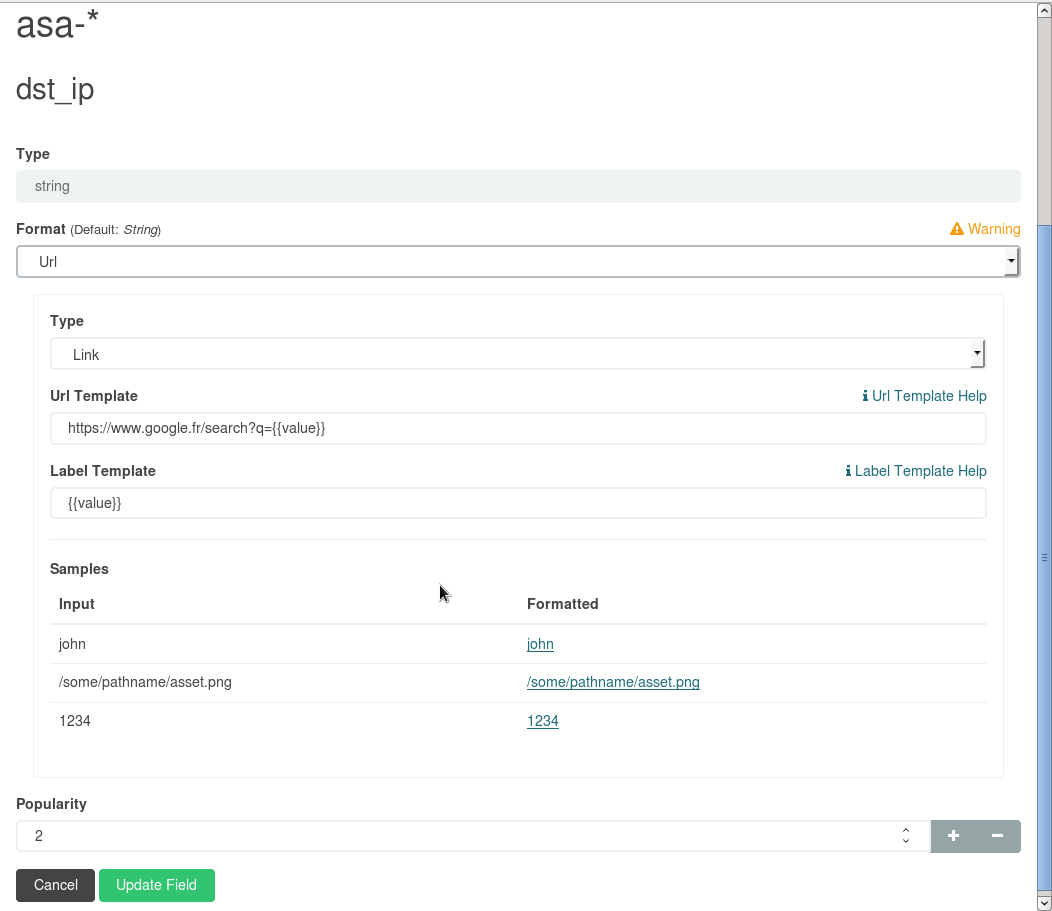
    • Field formatting with URL links 
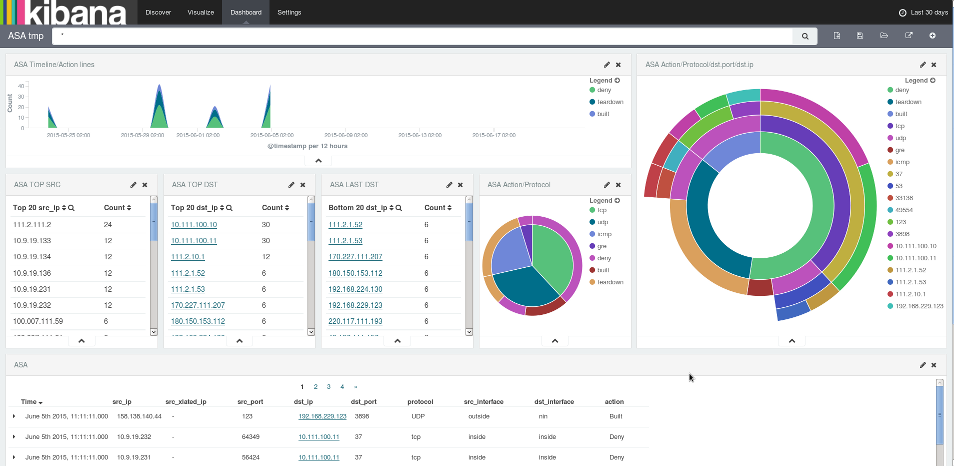
    Kibana 4.1 dashboard

Field formating: URL

If you want to use URL links, you need to use the Field formatting feature. Goto Settings > Indices > select your Index
Then select (edit) the field on which you want to add a URL and change the combo box "Format" from "default" to URL
And then customize your URL and URL template. In this screenshot, the result display "IPaddr # Google IT" and lunch the URL google.com/search?q=IPaddr  Do not forget to click on the "update field" button to confirm and enjoy !

Dashboard download

You can get Kibana 4 dashboards here.

Monday, May 18, 2015

Monitoring Cisco Asa logs with ELK

Intro

I have started to write my configuration files after reading these blogs
I won't come back once again on "howto" install the ELK stack, you will find some clues in these 2 blogs or in the elastic website. 

And do not forget, this is just a tool ... you need a human behind it.

Logstash part

The configuration file (tested with logstash 1.4.2) is available here : Raw Cisco ASA logstash config file

Warning : Do not forget this simple rule with logstash: if you are using several configuration files in your /etc/logstatsh/conf.d directory  (which I do), do not forget to put conditions in your input / filter / output section. If you don't, you will have some suprises (such as multiple logs entry) because logstash is compiling all files included in this directory in the equivalent of one unique big file. 

This configuration file assume that your ASA logs are written in the /var/log/collection/asa/ directory (via rsyslog configuration). Logstash can also receive logs directly from your network.

I decide to send all my ASA logs into a dedicated index file [asa-]YYYY.MM.DD
This helps me to make a "logrotate" policy of my indexes depending on my type of logs and optimizing my queries : only ASA indexes are called for this ASA dashboard.

My logstash configuration will do indexing with the date included in the logs. Useful if you are doing post mortem logs import or if you are facing some downtime in the logs forwarding process.

 
Use and abuse of :
/opt/logstash/bin/logstash -t -f /etc/logstash/conf.d/myconf.conf
Check your logstash configuration before doing a restart (reload does not exist in logstash 1.4/1.5 and is planned in roadmap for the 2.0).

If you want to adapt your TimeZone, please check: http://joda-time.sourceforge.net/timezones.html


Kibana 3 part

The dashboard for investigation. You can get it there.
I am using it in full screen mode with a 1920x1080 screen.
Kibana 3 Cisco ASA sample dashboard
This dashboard is divided in 3 rows :
  1. Time line and different terms widgets
  2. GeoIP widgets
  3. Table with logs

Time line & terms widget

IMHO even if it is better to do vertical scrolling than lateral scrolling (the Kibana 3 framework is preventing lateral scrolling), I like to have all my important widgets without any scrolling. Thus, I am not using a full wide time line widget (8 span of 12).
 

For the demo, on the second line, I have put the revert count in "bar" format to color the dashboard and show you different options, but I rather like to use the "table" form. The bar or pie are more graphical, but can't be used for excluding a data from your investigation, only zoom in, which I do most of the time.
Include / Exclude action


GeoIP widgets

Most of the time the GeoIP widgets are fun to see, but could not be relevant because of the customer standard web browsing on the Internet (websites are hosted everywhere !). It will get some more interest when you will do filtering during your investigation. For example, if you search outgoing DNS traffic, you may find some traffic going place where they should not. This is the reason why, this is a dedicated row in my dashboard : you can collapse it when you wants.

Table with logs

Nothing special there. 

Kibana 4

This won't be for this time. 
Kibana 4 sample dashboard
Even if Kibana 4 is really great with new multi aggregation features, it has some drawbacks.
  • At the time of this post, Kibana is in 4.0.2 and it is not possible to export the schema of a dashboard such as in Kibana 3. It is on the future 4.1.0 version.
  • Kibana 4.0.2 and Firefox ESR are not best friends (script are running 100% of CPU when editing visualization with non analyzed fields).

This could be an update in an few time with Kibana 4.1.
[Update : June 22, 2015 : link to the new blog post]


Disclaimer

All IP in my dashboard are fake IP for demo purpose

Sunday, May 17, 2015

Security monitoring: how, why, where, who, when ...

Introduction to this blog

How can I manage my team, my IT ... to do the job ?
Why doing security monitoring ?
Where to start my project ? Where will be the end ?
Who can do the job inside or outside my company ? Who will be involved ?
When should I monitor my company ? Once a week, once day, business hours, 24/24 ?

Lot of questions with different answers depending on your needs, your budget and your team !

This blog is here to share with you some of my thoughts around these questions about monitoring and more(*). I will try to give some clues here, but do not rely on only one read for forging your mind. Read others, discus with specialist, try, retry and never give up.

Every company has his own needs and his maturity level. Unfortunately, there is no "perfect" answer. Filling a spread sheet or a survey won't give you the "big plan" to follow. You will still need some human brain to choose the best plan and follow IT  ( <= yes, follow it, follow your IT we will discuss around it later). And this plan should be renewed as needed.

(*) Monitoring is just part of the job. You need some steps to help monitoring stuff (such as hardening)  and you will have other steps after (such as incident response time). These themes fall into the "more" family of this blog and family means nobody gets left behind or forgotten ! Ohana ;-)